📣 Announcements
Join SORTEE to get session links
Check out the resources page for beginner-friendly guides
No previous coding experience needed — all skill levels welcome!
Who We Are
SORTEE Code Club is part of the Society for Open, Reliable, and Transparent Ecology and Evolutionary Biology (SORTEE) .
We meet every month to learn, share, and improve our coding skills. Whether you’re debugging your first R script or building a Shiny app, there’s a place for you here.
We cover:
🐍 R and Python for ecological data analysis
📊 Data visualisation with ggplot2 and beyond
🔁 Reproducible workflows with Quarto and RMarkdown
🌐 Open science tools: OSF, GitHub, Zenodo
A Little Reproducible Science 🔬
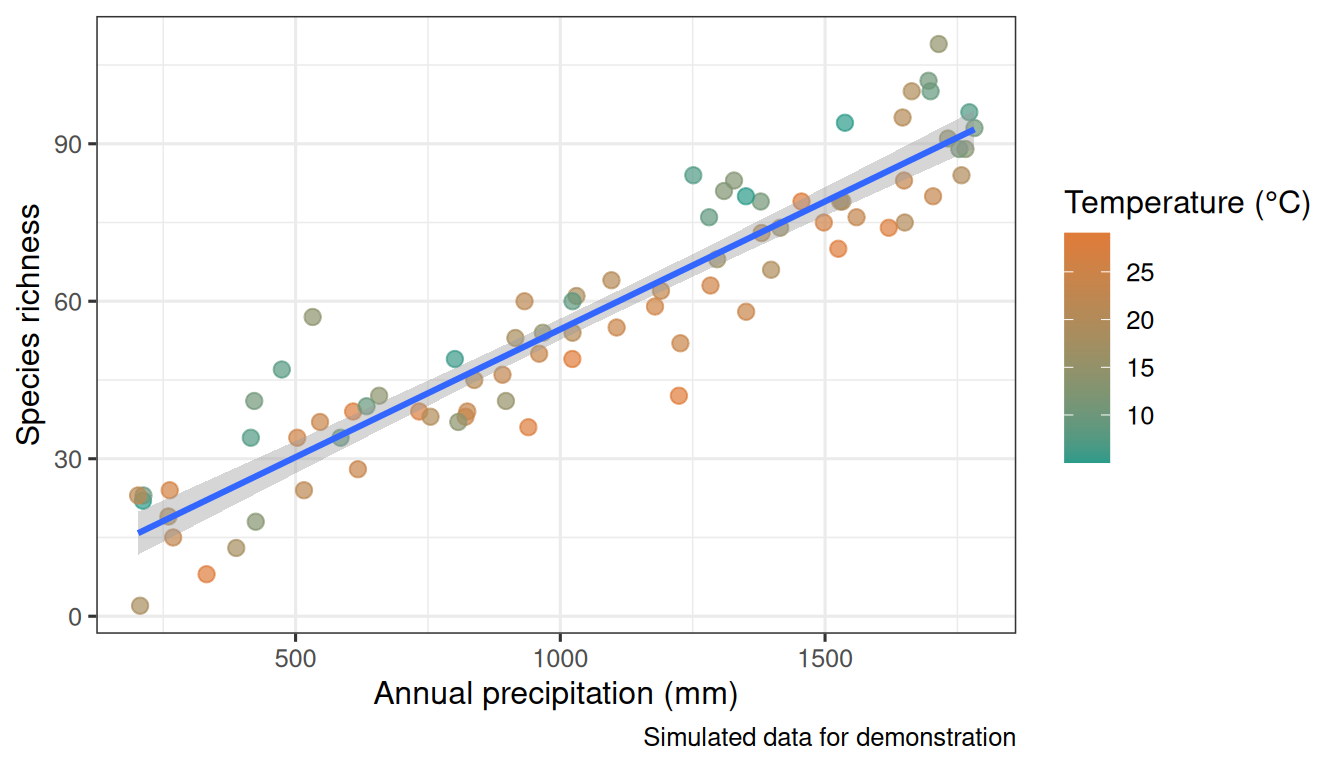
The plot below is generated from R code embedded directly in this page — this is what makes Quarto powerful!
library (ggplot2)set.seed (42 )<- 80 <- data.frame (precipitation_mm = runif (n, 200 , 1800 ),temperature_c = runif (n, 5 , 30 ))$ species_richness <- round (0.05 * data$ precipitation_mm - 0.8 * data$ temperature_c + rnorm (n, 0 , 8 ) + 20 )ggplot (data, aes (x = precipitation_mm, y = species_richness, colour = temperature_c)) + geom_point (alpha = 0.7 , size = 2.5 ) + geom_smooth (method = "lm" , se = TRUE ) + scale_colour_gradient (low = "#2C9B8A" , high = "#E07B39" ,name = "Temperature (°C)" ) + labs (x = "Annual precipitation (mm)" ,y = "Species richness" ,caption = "Simulated data for demonstration" ) + theme_bw (base_size = 12 )
Get Involved
We’re always looking for people to share their coding knowledge — beginners welcome! You could run a:
Tutorial (30–45 min): teach a skill you’ve recently learnedCode review (20 min): share a workflow for group feedbackDemo (10 min): show a package or tool you like
Express interest →
Missing something from our schedule? Tell us what you’d like to learn.
Current wishlist:
Bayesian statistics in R (Stan / brms)
Spatial data with sf and terra
Machine learning for ecologists
Python for R users
Open an issue on GitHub →
SORTEE Code Club is a volunteer-run community committed to a welcoming, inclusive environment for all skill levels. Read our Code of Conduct .